The Asia-Europe route stands as the world's most significant container shipping corridor, enabling vital global trade flows between Asia's manufacturing hubs and Europe's major consumer markets. In 2025, approximately 19.6 million TEUs will be transported from Asia to Europe—representing 10.3% of all global container movements.
For logistics professionals and shippers, understanding this trade lane's dynamics is essential. From evolving routing patterns to port selection strategies, mastering Asia-Europe shipping directly impacts supply chain efficiency, transit reliability, and overall costs.
Current Routing Situation: Cape of Good Hope vs. Suez Canal
Since late 2023, the Asia-Europe trade lane has experienced significant routing disruptions. Due to security concerns in the Red Sea region, major carriers have rerouted vessels via the Cape of Good Hope instead of the traditional Suez Canal passage.
The Cape of Good Hope route adds approximately 7–14 days to transit times compared to the Suez Canal passage. This change has significant implications for supply chain planning:
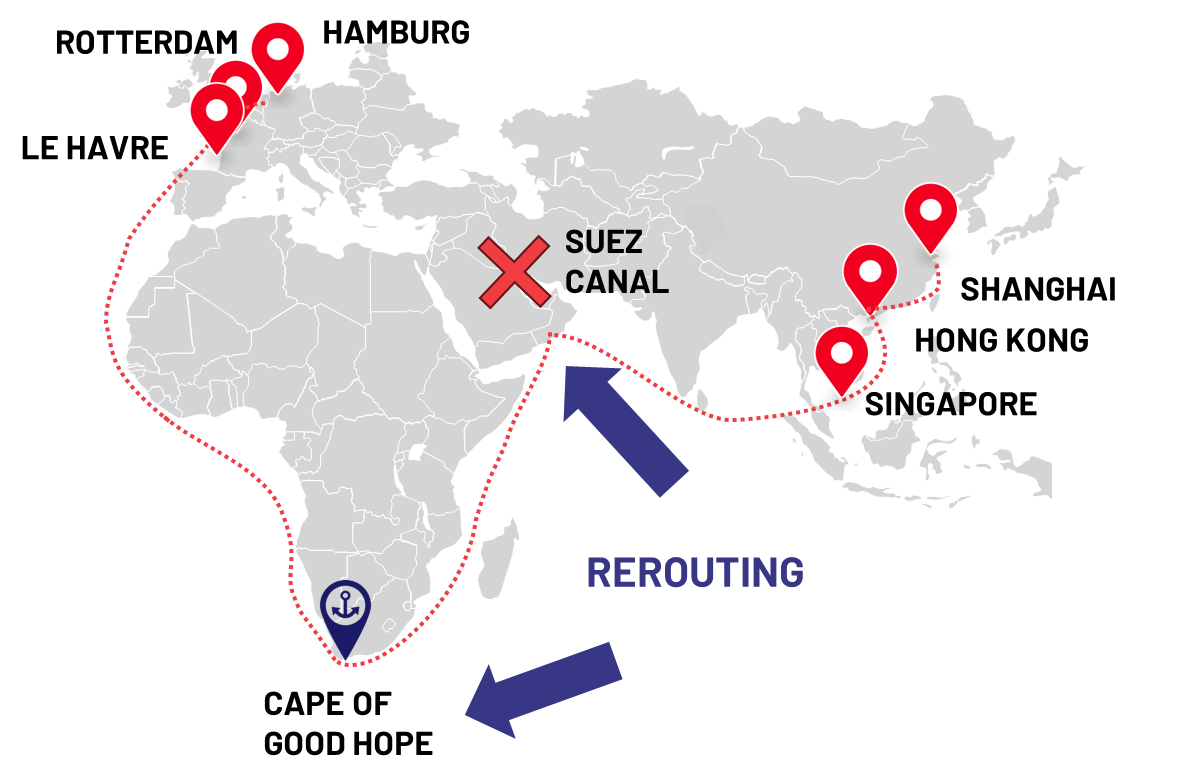
- Extended transit times: Approximately 2 weeks added per voyage
- Increased operational costs: Higher fuel consumption and vessel deployment requirements
- War risk insurance premiums: Red Sea transits now carry premiums of 0.5%–1.0% of hull/machinery value, compared to 0.0001% in the Persian Gulf
| Region | Current War Risk Premium (% of H&M value) | Pre-crisis/Baseline Premium (%) |
|---|---|---|
| Red Sea | 0.5% – 1.0% (peaking at 2%) | ~0.1% – 0.3% |
| Persian Gulf | 0.2% – 0.5% | ~0.05% – 0.125% |
How Retailers Have Adapted: The New Holiday Season Shipping Calendar
Cape of Good Hope routing is no longer a temporary disruption. It's now the operating reality for a third consecutive peak season, and retailers and shippers have rebuilt their planning calendars around it. The shift comes down to simple transit-time maths: at 32–35 days via Suez, factories could ship as late as September and still land stock on European shelves in time for the November-December holiday season. At 45–60 days via the Cape, that same shelf-ready deadline now requires cargo to leave Asia three to four weeks earlier.
| Factor | Pre-2023 (Via Suez Canal) | 2026 Reality (Cape of Good Hope) |
|---|---|---|
| Typical Transit Time | 32–35 days | 45–60 days |
| Holiday Shipping Cut-Off | Late September – early October | Late July – late August |
| Peak Volume Window | August – October | June – August |
The practical effect: Asia-Europe's peak season now starts and ends roughly a month earlier than the pre-2023 calendar most shippers grew up with. By late August, the bulk of holiday-driven volume has already moved, and spot rates typically begin softening from there. Asia-North Europe rates have fallen for eight consecutive weeks since the 2026 peak wound down. This is now a predictable, structural pattern rather than a one-off adjustment, so it's worth building the earlier cut-off directly into next year's sourcing and shipping calendar rather than treating it as an exception each time it arrives.
One consequence worth flagging for shippers running multi-region networks: Transpacific routings aren't affected by Cape diversions, so the US peak season calendar hasn't shifted the same way—meaning Europe-bound and North America-bound cargo out of the same Asian factories can now sit on noticeably different booking timelines.
Major Asian Origin Ports
Asian origin ports span multiple countries and serve as crucial departure points for Europe-bound cargo. Understanding each port's capabilities and carrier service patterns enables more strategic booking decisions.
| Country | Key Ports |
|---|---|
| South Korea | Busan |
| Greater China | Tianjin, Qingdao, Shanghai, Ningbo, Xiamen, Yantian, Shekou, Kaohsiung |
| Singapore | Singapore |
| Vietnam | Ho Chi Minh City |
Note: Port calls are subject to variations in carrier service strings and arrangements. For other Asian ports or inland cities, standard arbitrary charges will apply.
European Destination Ports
European ports are organised across three major regions: North Europe, West Mediterranean, and East Mediterranean. Each region offers distinct advantages depending on cargo destinations and supply chain requirements.
| Region | Country | Port Name(s) |
|---|---|---|
| North Europe | Germany | Hamburg, Bremenhaven, Wilhelmshaven |
| North Europe | Netherlands | Rotterdam |
| North Europe | Belgium | Antwerp, Zeebrugge |
| North Europe | France | Le Havre, Dunkerque |
| North Europe | United Kingdom | Felixstowe, Southampton, London Gateway |
| North Europe | Poland | Gdansk |
| West Med | Italy | Genoa, La Spezia |
| West Med | Spain | Barcelona, Valencia, Algeciras |
| West Med | France | Marseille / FOS |
| East Med | Greece | Piraeus |
| East Med | Turkey | Istanbul, Izmir, Mersin |
| East Med | Israel | Haifa / Ashdod |
| East Med | Egypt | Alexandria, Port Said |
Strategic Shipping Considerations
Trade volume growth on the Asia-Europe corridor influences carrier planning, port investments, and alliance formations globally. Shippers should consider several strategic factors when planning their ocean freight operations:
Transit Time Planning
With current Cape of Good Hope routing, build additional buffer time into supply chain schedules. Standard transits now range from 45–60 days depending on origin and destination.
Carrier Selection
Different alliances offer varying service frequencies and port coverage. Match carrier selection to your specific origin-destination requirements and reliability priorities.
Cost Management
Longer routings impact fuel costs and surcharges. Monitor carrier pricing structures and consider contract strategies to manage rate volatility.
Port Selection
Evaluate discharge port options based on inland connectivity, transit times, and current congestion levels. Mediterranean ports may offer faster access to Southern European markets.
Navigate Rising Costs: Prepare Your Asia-Europe Supply Chain Now
The regulatory landscape for Asia-Europe shipping is transforming rapidly, and the cost implications are substantial. EU Emissions Trading System surcharges nearly doubled in 2025 as coverage increased from 40% to 70%, and full 100% coverage took effect on 1 January 2026, with methane and nitrous oxide now brought into scope alongside CO2 for the first time. Combined with FuelEU Maritime regulations now in effect, per-TEU environmental compliance costs could reach €105 depending on vessel efficiency and routing. The question isn't whether these costs will impact your business—it's how prepared you are to manage them.
Adding to the complexity, the EU abolished its €150 customs duty exemption for low-value imports on 1 July 2026, replacing it with a temporary flat €3 duty per item pending the EU Customs Data Hub's launch in 2028. A separate EU-wide e-commerce handling fee is expected to follow from November 2026. For businesses shipping consumer goods from Asia to European customers, this represents a fundamental shift in landed cost calculations.
Meanwhile, Red Sea diversions continue pushing vessels around the Cape of Good Hope, adding 10–14 days to transit times and approximately 30% more fuel consumption—costs that ultimately flow through to shippers while generating additional ETS liabilities. The environmental paradox is clear: longer routes mean higher emissions and greater regulatory exposure.
Smart businesses are acting now. With fleet capacity growing faster than demand, 2026 offers opportunities to secure favourable contract rates while optimising your European distribution strategy. SEKO Logistics operates fulfilment centres across the United Kingdom, Netherlands, and France, enabling you to position inventory closer to EU customers, reduce customs complexity, and minimise environmental surcharge exposure.